

The cryptocurrency market has witnessed dramatic volatility as Bitcoin recently dropped below the psychological $110,000 threshold, sending shockwaves through the digital asset ecosystem. For traders and investors navigating this turbulent landscape, understanding Bitcoin price levels has become more crucial than ever. As market participants scramble to assess the damage and identify potential opportunities, monitoring specific Support and resistance zones could mean the difference between profit and substantial losses.
This comprehensive analysis examines the most critical Bitcoin price levels that demand immediate attention following the recent market correction. Whether you’re a seasoned trader or a long-term investor, understanding these key technical markers will help you make informed decisions in an increasingly volatile market environment. The cryptocurrency’s journey below $110,000 represents a significant psychological and technical shift that requires careful examination of both historical patterns and current market dynamics.
Bitcoin’s Recent Price Action and Market Context
The $110,000 Breakdown: What It Means for Traders
Bitcoin’s decline below $110,000 represents more than just a simple price correction. This level served as a crucial psychological barrier that many analysts had identified as a make-or-break point for the cryptocurrency’s continued bullish momentum. The breakdown has triggered a cascade of technical signals that are reshaping the broader Bitcoin price levels landscape.
The magnitude of this correction reflects several underlying factors, including institutional profit-taking, regulatory uncertainties, and broader macroeconomic pressures. Understanding these catalysts provides essential context for evaluating which Bitcoin price levels are most likely to hold during this period of increased volatility.
Market sentiment has shifted dramatically as traders reassess their positions and risk management strategies. The psychological impact of losing the $110,000 level cannot be understated, as it represented a significant milestone in Bitcoin’s price discovery process. This shift in sentiment often creates self-reinforcing cycles that can push prices toward key technical support zones.
Technical Analysis Framework for Bitcoin Price Levels
Professional traders rely on multiple time frame analysis when evaluating Bitcoin price levels. The daily, weekly, and monthly charts each provide unique insights into potential Support and resistance zones that could influence future price action. Understanding this multi-layered approach is essential for identifying the most reliable levels to monitor.
Fibonacci retracement levels have historically played a crucial role in Bitcoin’s price movements. The 38.2%, 50%, and 61.8% retracement levels from recent highs often serve as magnets for price action during corrective phases. These mathematically derived levels frequently align with other technical indicators to create confluence zones.
Volume profile analysis adds another dimension to the evaluation of Bitcoin price levels. Areas where significant trading volume has occurred in the past often act as Support or resistance in future price movements. This volume-based approach helps identify levels where buyers and sellers have previously shown strong interest.
Critical Support Levels to Monitor Immediately
Primary Support Zone: $95,000 – $98,000
The $95,000 to $98,000 range represents the most critical immediate support area for Bitcoin following its drop below $110,000. This zone encompasses several important technical confluences that make it a high-probability area for price stabilisation or reversal. Historical analysis shows that this range has served as both support and resistance multiple times, creating a well-established level of market memory.
Within this support zone, the $96,500 level warrants particular attention as it aligns with the 38.2% Fibonacci retracement from Bitcoin’s most recent significant low to its highs above $ 110,000. This mathematical relationship, combined with previous price action around this level, creates a compelling case for potential buying interest.
The volume profile data reinforces the importance of this support zone, showing significant trading activity in the $95,000-$98,000 range during previous market cycles. High-volume nodes like these often act as magnets for future price action, as they represent areas where both institutional and retail participants have shown strong interest in accumulating or distributing Bitcoin.
Secondary Support: $88,000 – $92,000
Should Bitcoin fail to find stability in the primary support zone, the $88,000 to $92,000 range becomes the next critical area to monitor. This secondary support level represents a deeper retracement that would align with the 50% Fibonacci level from recent price movements. The psychological significance of these round numbers cannot be ignored, as they often attract increased buying interest from value-oriented investors.
The $90,000 level, in particular, carries significant weight as a major psychological support. Round numbers in Bitcoin’s price history have frequently served as turning points, and the current market structure suggests this level could provide a foundation for potential recovery. Technical indicators suggest that a test of this zone could coincide with oversold conditions that might attract bargain hunters.
Market structure analysis reveals that the $88,000-$92,000 range has previously acted as a launching pad for significant upward moves. This historical context lends credibility to the potential for this zone to serve as a base for future price appreciation, making it essential for traders to monitor price action around these levels closely.
Resistance Levels That Could Cap Recovery Attempts
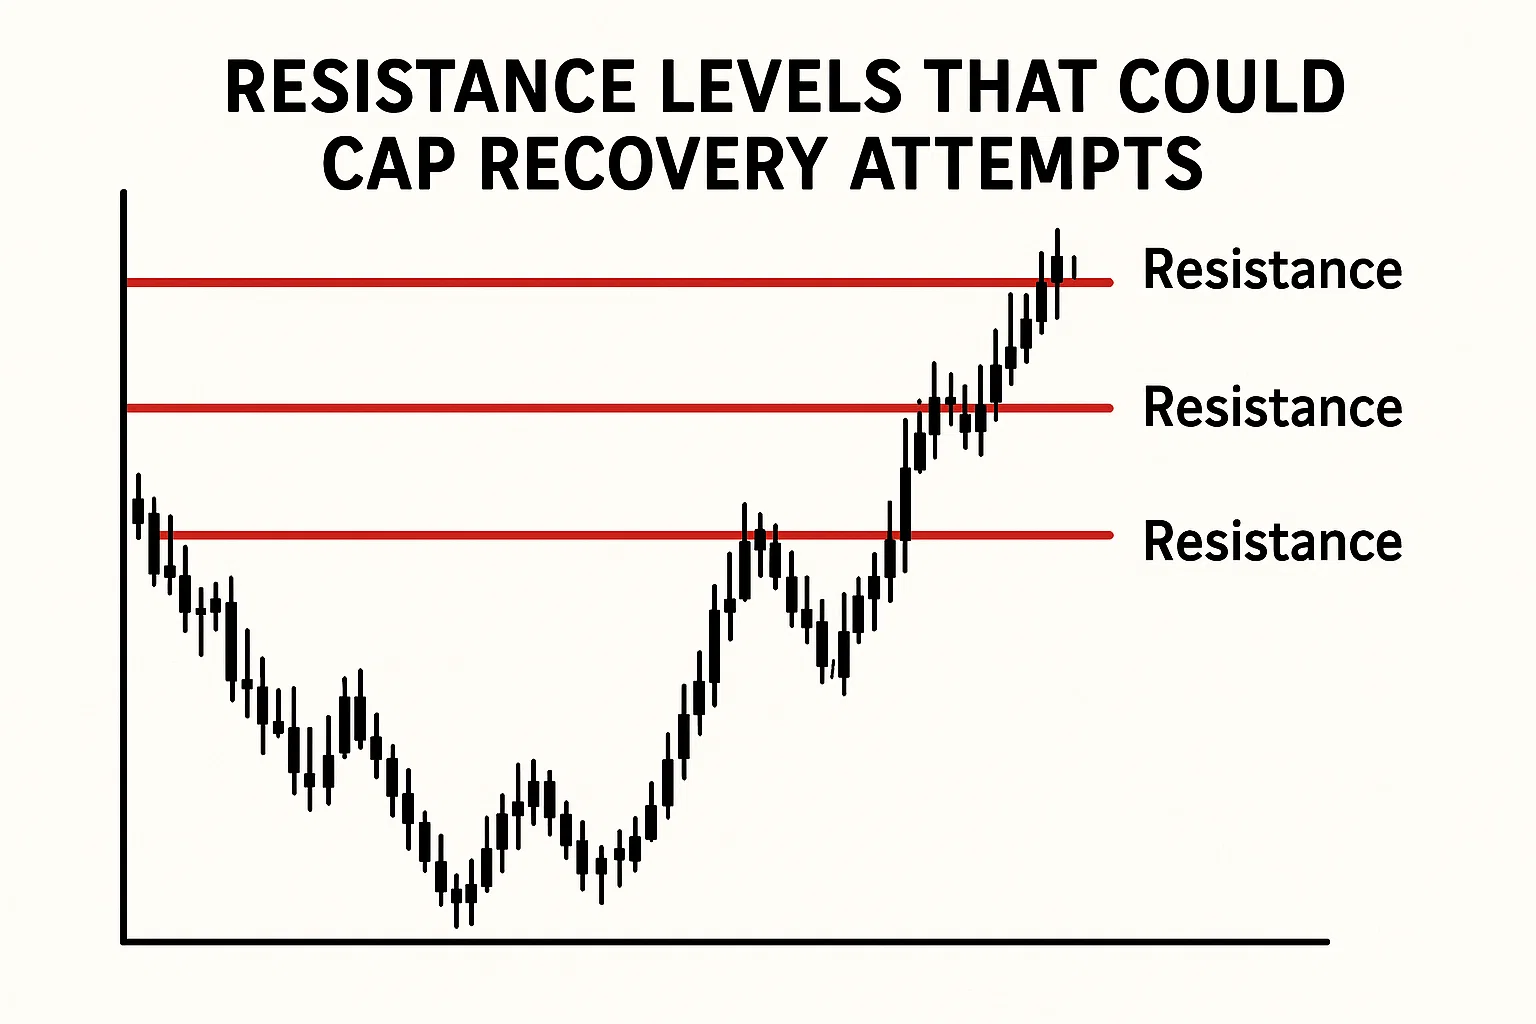
Immediate Resistance: $105,000 – $108,000
Any recovery attempt from current levels will likely face significant resistance in the $105,000 to $108,000 range. This zone represents a classic “broken support becomes resistance” scenario, where previously supportive levels now serve as overhead supply. The technical principle behind this transformation makes these Bitcoin price levels particularly important to monitor during any rebound attempts.
The $106,500 level within this resistance zone warrants special attention, as it aligns with previous consolidation patterns and represents a logical area for sellers to reemerge. Trading activity around this level could provide important clues about the strength of any recovery attempt and whether buyers have sufficient conviction to push through this overhead supply.
Options flow data and derivatives positioning suggest significant interest in the $105,000-$108,000 range, with substantial put option activity concentrated around these levels. This institutional positioning could create additional selling pressure if Bitcoin approaches these levels during any recovery attempt.
Significant Resistance: $112,000 – $115,000
The $112,000 to $115,000 range represents a significant resistance zone that needs to be reclaimed for Bitcoin to resume its previous uptrend. This area encompasses the recent breakdown point and represents a critical test of market sentiment. Reclaiming this zone would signal that the recent correction was merely a temporary setback rather than the beginning of a more substantial bear market.
Technical analysis suggests that any move back above $113,000 would negate much of the bearish damage caused by the initial breakdown. This level represents not only a price target but also a psychological threshold that could restore confidence among both institutional and retail investors.
The volume required to reclaim this resistance zone will be substantial, likely requiring renewed institutional interest and positive fundamental catalysts. Monitoring the volume and momentum characteristics of any approach to these levels will provide crucial insights into the sustainability of any recovery attempt.
Key Fibonacci Levels and Their Significance
Understanding Fibonacci Applications in Bitcoin Trading
Fibonacci retracement and extension levels have proven remarkably reliable in Bitcoin’s price history, making them essential tools for identifying critical Bitcoin price levels. The mathematical relationships inherent in these levels seem to resonate with market psychology, creating self-fulfilling prophecies that influence trader behaviour across multiple timeframes.
The current market structure presents several critical Fibonacci levels that could influence Bitcoin’s price action. From the recent highs above $110,000 to significant previous lows, multiple Fibonacci sequences are converging to create high-probability zones for Support and resistance. Understanding these relationships provides a mathematical framework for evaluating potential turning points.
Golden ratio relationships within Bitcoin’s price movements have historically coincided with significant trend changes and continuation patterns. The 61.8% and 38.2% retracement levels, in particular, have served as reliable indicators of trend strength and potential reversal zones throughout Bitcoin’s price history.
Specific Fibonacci Targets to Watch
The 38.2% retracement from Bitcoin’s recent rally places a key level around $96,800, which aligns closely with our previously identified primary support zone. This mathematical confluence strengthens the case for this area to provide meaningful Support during the current correction. Historical analysis shows that shallow retracements to the 38.2% level often precede trend continuation moves.
A deeper correction to the 50% Fibonacci level would target approximately $91,200, falling within our secondary support zone. This level represents a more significant test of the underlying trend but has historically provided strong Support during healthy corrections in bull markets. The psychological significance of the 50% retracement often attracts value buyers looking for discounted entry points.
The 61.8% retracement level, often referred to as the “golden ratio,” would target the $85,500-$87,000 range. A correction to this level would represent a more serious challenge to Bitcoin’s uptrend and could signal a potential shift in market structure. However, corrections to this level have also historically provided excellent long-term buying opportunities for patient investors.
Volume Analysis and Market Structure Insights
Volume Profile Implications
Volume profile analysis reveals critical insights about Bitcoin price levels by identifying areas where significant trading activity has occurred. These high-volume zones often act as support and resistance levels because they represent areas where many market participants have established positions. Understanding these volume-based levels provides additional confirmation for our technical analysis.
The Point of Control (POC) from recent trading activity is around $101,500, representing the price level at which the most Bitcoin has changed hands. This level could serve as a magnet during any recovery attempt, as it represents fair value based on recent market activity. Traders often reference POC levels when establishing position sizes and risk management parameters.
Value Area analysis shows that roughly 70% of recent trading volume has occurred between $98,000 and $107,000. This range encompasses both our primary support zone and immediate resistance levels, suggesting that price action within this range could be characterised by increased volatility and trading activity.
Order Flow and Liquidity Considerations
Institutional order flow patterns provide additional context for understanding critical Bitcoin price levels. Significant block trading activity and dark pool transactions often cluster around significant technical levels, creating zones of enhanced liquidity that can either support or pressure prices depending on the nature of the orders.
Recent order flow data suggests significant buy-side interest in the $94,000-$98,000 range, potentially providing a floor for the current correction. However, this buying interest could be absorbed quickly if selling pressure intensifies, making it crucial to monitor the pace and volume of any decline toward these levels.
Liquidity gaps above current levels, particularly around $109,000 and $114,500, could create areas of rapid price movement if Bitcoin begins to recover. These gaps represent areas where relatively few shares are available to trade, potentially leading to explosive moves if buyers emerge with sufficient force to push through these zones.
Risk Management Strategies for Current Market Conditions
Position Sizing and Entry Strategies
Given the elevated volatility around critical Bitcoin price levels, implementing proper risk management becomes paramount for both traders and investors. Position sizing should reflect the increased uncertainty and potential for rapid price movements that characterise the current market environment. Conservative position sizes allow traders to weather volatility while maintaining the ability to add to positions at more favourable levels.
Dollar-cost averaging strategies become particularly valuable during periods of heightened volatility around key technical levels. Rather than attempting to time exact bottoms, systematic accumulation near identified support zones can help smooth out entry prices and reduce the impact of short-term volatility on overall portfolio performance.
Stop-loss placement requires careful consideration of the technical levels we’ve identified. Placing stops too close to current prices risks getting stopped out by normal market volatility, while stops that are too wide may not provide adequate protection against significant adverse price movements. The key is finding the balance that protects while allowing positions room to breathe.
Hedging and Portfolio Protection
Options strategies can provide valuable protection during volatile periods around critical Bitcoin price levels. Purchasing options on Bitcoin or Bitcoin-related securities can offer downside protection while allowing for participation in any potential recovery. The cost of this protection should be weighed against the potential benefits and overall portfolio objectives.
Correlation analysis with other risk assets becomes crucial during periods of market stress. Bitcoin’s correlation with traditional assets tends to increase during periods of uncertainty, potentially reducing its diversification benefits. Understanding these relationships helps in making informed decisions about overall portfolio allocation and hedging strategies.
Alternative hedging strategies, such as short positions in highly correlated assets or pairs trades within the cryptocurrency ecosystem, may provide more cost-effective protection than traditional options strategies. These approaches require a sophisticated understanding of market relationships but can offer more flexible risk management solutions.
Technical Indicators and Momentum Analysis
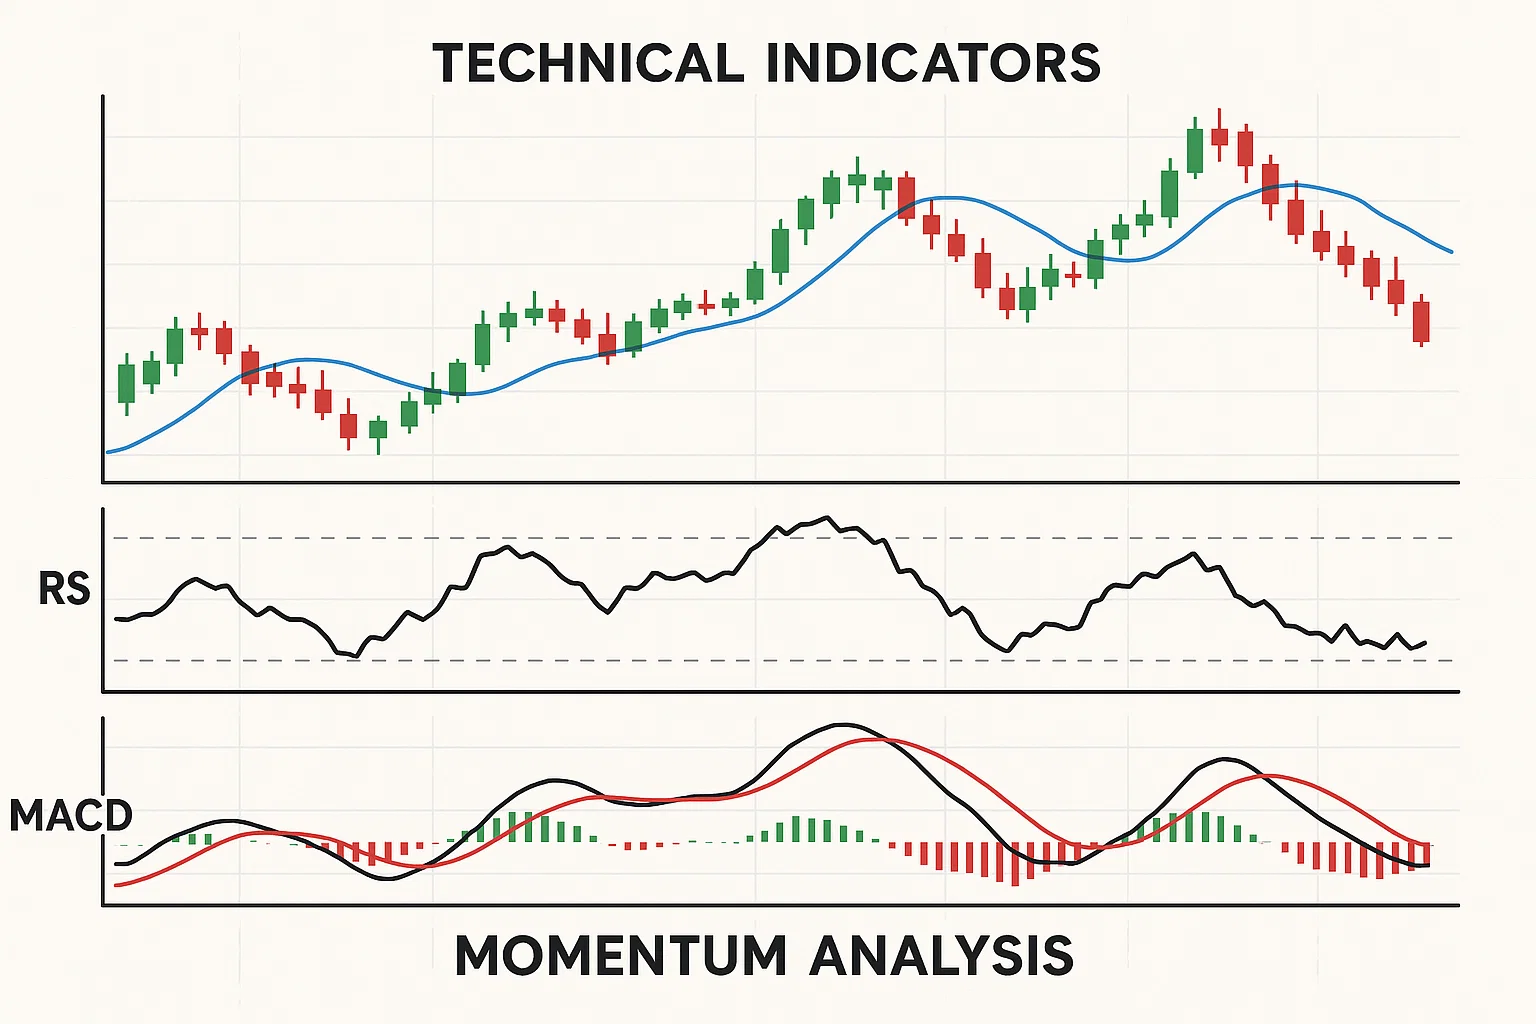
RSI and Momentum Oscillators
Relative Strength Index (RSI) readings offer valuable context for assessing Bitcoin price levels and identifying potential turning points. Current RSI levels suggest that Bitcoin may be approaching oversold territory, which historically has coincided with at least temporary bounce attempts. However, RSI can remain oversold for extended periods during strong trending moves, making it essential to confirm signals with other technical indicators.
MACD analysis shows deteriorating momentum following Bitcoin’s drop below $110,000. The crossing of signal lines and the relationship between the MACD line and its histogram provide insights into the strength and sustainability of current price trends. These momentum indicators help confirm whether price movements around critical levels are likely to continue or reverse.
Stochastic oscillators on multiple timeframes provide additional perspective on Bitcoin’s position relative to recent trading ranges. The alignment of stochastic signals across different timeframes can provide higher-probability entry and exit signals around the critical Bitcoin price levels we’ve identified.
Moving Average Analysis
Bitcoin’s relationship with key moving averages provides structural context for evaluating current price levels. The 20-day, 50-day, and 200-day moving averages create a framework for understanding trend strength and potential Support or resistance levels. Current price action relative to these averages suggests a shift in market structure that requires careful monitoring.
The 50-day moving average, currently around $103,500, represents a dynamic resistance level that could cap near-term recovery attempts. Historical analysis shows that Bitcoin’s ability to reclaim and hold above this level often signals trend continuation, while failure to do so may indicate further weakness ahead.
Exponential moving averages (EMAs) often provide more responsive signals than simple moving averages, particularly during periods of increased volatility. The 21 EMA and 55 EMA crossovers have historically provided reliable signals for trend changes in Bitcoin, making them valuable tools for evaluating current market conditions around critical price levels.
Market Sentiment and Fundamental Factors
Fear and Greed Index Implications
Market sentiment indicators provide crucial context for understanding the psychology behind Bitcoin price levels and potential turning points. The Crypto Fear and Greed Index has shifted dramatically following Bitcoin’s drop below $110,000, moving from extreme greed territory toward more neutral or fearful readings. These sentiment shifts often coincide with significant price movements and potential reversal opportunities.
Historical analysis reveals that extreme fear readings have often presented excellent buying opportunities for long-term investors, while extreme greed readings have signalled potential market tops. The current sentiment shift following the $110,000 breakdown may be creating conditions for a sentiment-driven bounce if technical levels hold.
Social media sentiment analysis and news flow monitoring provide additional insights into market psychology around critical price levels. The shift in narrative from euphoria to concern can create self-reinforcing cycles that either Support or undermine technical levels. Understanding these psychological factors helps in making informed timing decisions for entry and exit.
Institutional Activity and Flow Analysis
Institutional Bitcoin flows provide crucial insights into the sustainability of Support around critical Bitcoin price levels. Recent institutional buying or selling activity can provide early warning signs of potential level breaks or successful tests. Monitoring institutional activity helps distinguish between temporary corrections and more significant structural changes.
Exchange flow data shows patterns of Bitcoin movement that often precede significant price moves around key technical levels. Large inflows to exchanges may signal potential selling pressure, while outflows often indicate accumulation and potential support for critical levels. These flow patterns provide forward-looking indicators of supply and demand dynamics.
The Grayscale Bitcoin Trust (GBTC) and other institutional products provide additional context for understanding institutional sentiment regarding current Bitcoin price levels. Changes in institutional product premiums and discounts often reflect broader institutional appetite for Bitcoin exposure and can influence price action around key technical levels.
Conclusion
The current market environment following Bitcoin’s drop below $110,000 presents both significant challenges and compelling opportunities for traders and investors who understand the critical Bitcoin price levels outlined in this analysis. The key support zones at $95,000-$98,000 and $88,000-$92,000 represent the most critical areas to monitor for potential stabilisation or reversal signals.
Successful navigation of this volatile period requires a disciplined approach to Bitcoin price levels that combines technical analysis with proper risk management and an understanding of broader market dynamics. The resistance levels at $105,000-$108,000 and $112,000-$115,000 will serve as crucial tests of any recovery attempt, providing essential signals about the underlying strength of buyer demand.
Read more: Bitcoin Reclaims $115K: Watch These BTC Price Levels Next.